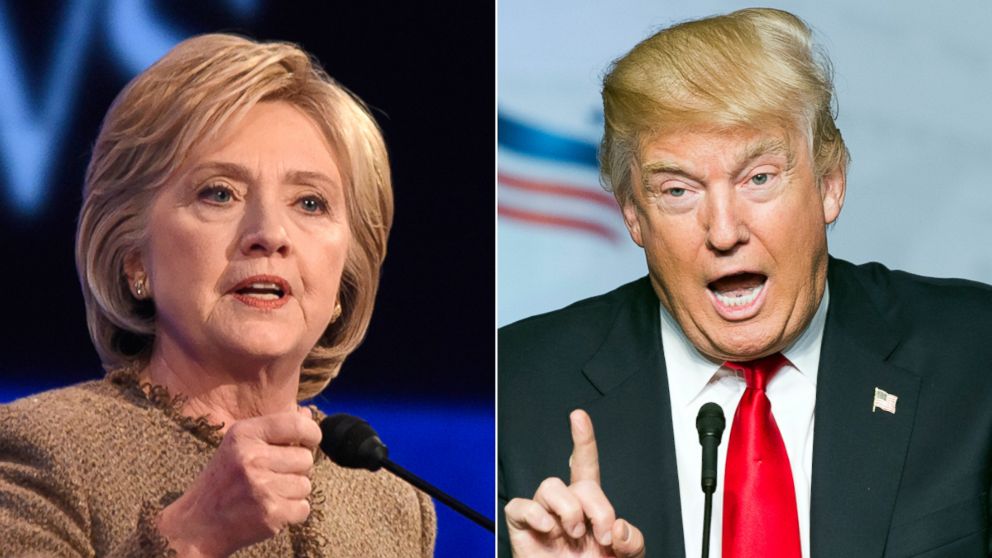
An average or median has been calculated from several polls and the results are below. Hillary Clinton is represented by blue and Donald Trump by red.
It's a tough task to gauge the mood of a nation that is home to more than 300 million people, but that doesn't stop the pollsters from trying.
National polls tend to have a sample size of about 1,000 people or more and can track movement and general opinion pretty well.
But the US election is won and lost in swing states and decided by the electoral college system (What is the electoral college?).
This means that polls in states that look like they could vote for either candidate (Florida, Ohio and Pennsylvania to name just a few) play an integral role in election projections.
If those states stay the same colour (blue for Clinton, red for Trump) through to election day - and both candidates win the remaining states they are expected to - it would be a clear victory for Hillary Clinton.
For Donald Trump to have a chance, he needs to turn Florida and Ohio red and win a few others too. As it stands, Clinton is ahead by a pretty small margin in both Florida and Ohio.
The latest poll averages in the battleground states are shown in the chart below. Some states are polled more frequently than others; not all the polls below will be showing a result from the same survey period.


Go to WAG for some laughs .
ReplyDeleteLove PIC